import yfinance as yf
import pandas as pd
import numpy as np
import matplotlib
matplotlib.use("Agg")
import matplotlib.pyplot as plt
import seaborn as sns
import os
# Optional (für p-value / regression)
try:
from scipy import stats
HAS_SCIPY = True
except Exception:
HAS_SCIPY = False
TICKERS = ["QQQ", "SPY", "IWM", "DIA", "^GDAXI"]
START = "1990-01-01"
END = None
N_JAN = 5
BOOTSTRAP_ITERS = 10000
SEED = 42
def plot_jan_effect(df, ticker, n_jan, save_dir="plots"):
os.makedirs(save_dir, exist_ok=True)
sns.set_style("whitegrid")
# 1) Scatter
fig = plt.figure(figsize=(8, 6))
colors = df["JanPos"].map({True: "green", False: "red"})
plt.scatter(df["JanRet"]*100, df["YearRet"]*100, c=colors, alpha=0.7)
plt.axhline(0, linewidth=1)
plt.axvline(0, linewidth=1)
plt.xlabel(f"Return first {n_jan} trading days of January (%)")
plt.ylabel("Full year return (%)")
plt.title(f"{ticker} – January Effect Scatter")
plt.tight_layout()
fig.savefig(os.path.join(save_dir, f"{ticker}_01_scatter.png"), dpi=160)
plt.close(fig)
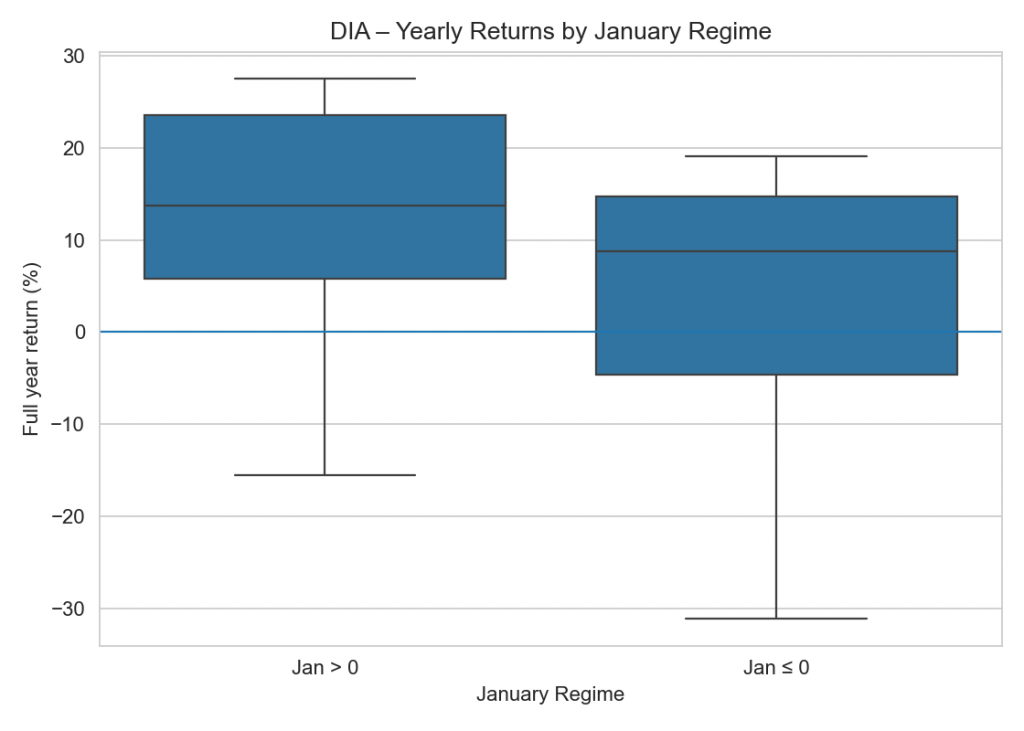
# 2) Boxplot
fig = plt.figure(figsize=(7, 5))
sns.boxplot(
x=df["JanPos"].map({True: "Jan > 0", False: "Jan ≤ 0"}),
y=df["YearRet"] * 100
)
plt.axhline(0, linewidth=1)
plt.xlabel("January Regime")
plt.ylabel("Full year return (%)")
plt.title(f"{ticker} – Yearly Returns by January Regime")
plt.tight_layout()
fig.savefig(os.path.join(save_dir, f"{ticker}_02_boxplot.png"), dpi=160)
plt.close(fig)
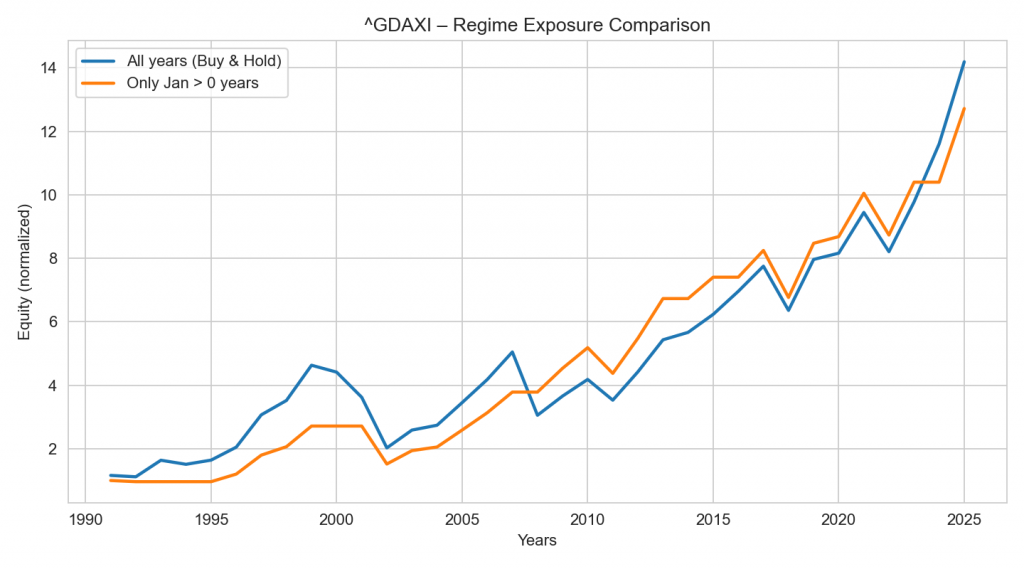
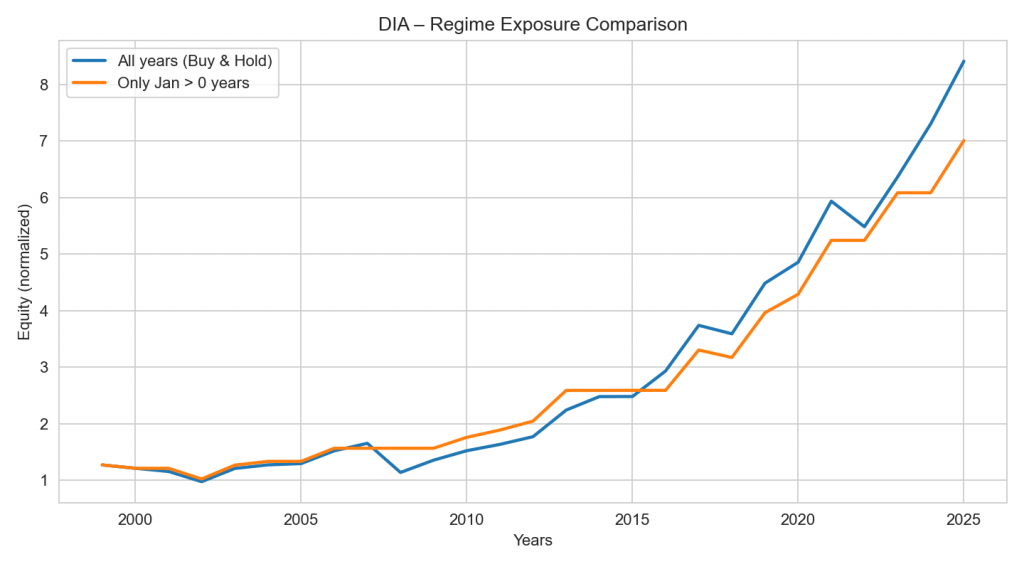
# 3) Equity-style
equity_all = (1 + df["YearRet"]).cumprod()
equity_jan_pos = (1 + df["YearRet"].where(df["JanPos"], 0)).cumprod()
fig = plt.figure(figsize=(9, 5))
plt.plot(df.index, equity_all.values, linewidth=2, label="All years (Buy & Hold)")
plt.plot(df.index, equity_jan_pos.values, linewidth=2, label="Only Jan > 0 years")
plt.legend()
plt.title(f"{ticker} – Regime Exposure Comparison")
plt.ylabel("Equity (normalized)")
plt.xlabel("Years")
plt.tight_layout()
fig.savefig(os.path.join(save_dir, f"{ticker}_03_equity.png"), dpi=160)
plt.close(fig)
def download_close_series(ticker: str) -> pd.Series:
df = yf.download(ticker, start=START, end=END, auto_adjust=True, progress=False)
if df is None or df.empty:
raise ValueError(f"No data returned for {ticker}.")
# yfinance returns columns like Open/High/Low/Close/Volume
# Ensure Close is a Series (not a DataFrame)
close = df["Close"]
if isinstance(close, pd.DataFrame):
# If something weird happens, take first column
close = close.iloc[:, 0]
close = close.dropna()
close.name = "Close"
return close
def compute_year_table(close: pd.Series, n: int) -> pd.DataFrame:
s = close.dropna().copy()
s = s.sort_index()
years = sorted(s.index.year.unique())
rows = []
for y in years:
s_y = s[s.index.year == y]
if s_y.empty:
continue
# January subset
s_jan = s_y[s_y.index.month == 1]
if len(s_jan) < n:
continue
jan_first_date = s_jan.index[0] # Timestamp
jan_n_date = s_jan.index[n - 1] # Timestamp
# previous trading day close before first January trading day
# robust approach: locate position via integer location
pos_first = s.index.get_loc(jan_first_date)
if isinstance(pos_first, slice) or isinstance(pos_first, np.ndarray):
# extremely rare, but handle duplicates defensively
pos_first = pos_first.start if isinstance(pos_first, slice) else int(pos_first[0])
if pos_first == 0:
continue
prev_close = float(s.iloc[pos_first - 1])
jan_n_close = float(s.loc[jan_n_date])
jan_ret = jan_n_close / prev_close - 1.0
# full-year return: first close of year to last close of year
year_ret = float(s_y.iloc[-1] / s_y.iloc[0] - 1.0)
rows.append({
"Year": y,
"JanRet": jan_ret,
"YearRet": year_ret,
"JanPos": jan_ret > 0,
"YearPos": year_ret > 0
})
df = pd.DataFrame(rows)
if df.empty:
raise ValueError("No valid yearly rows found. Check start date / data.")
return df.set_index("Year")
def summarize(df: pd.DataFrame, bootstrap_iters: int = 10000, seed: int = 42) -> dict:
pos = df[df["JanPos"]]
neg = df[~df["JanPos"]]
out = {}
out["Years"] = len(df)
out["HitRate_Pos"] = float(pos["YearPos"].mean()) if len(pos) else np.nan
out["HitRate_Neg"] = float(neg["YearPos"].mean()) if len(neg) else np.nan
out["MeanYear_Pos"] = float(pos["YearRet"].mean()) if len(pos) else np.nan
out["MeanYear_Neg"] = float(neg["YearRet"].mean()) if len(neg) else np.nan
out["Diff_PosMinusNeg"] = out["MeanYear_Pos"] - out["MeanYear_Neg"]
out["Corr_Jan_Year"] = float(df["JanRet"].corr(df["YearRet"]))
# Welch t-test (optional)
if HAS_SCIPY and len(pos) >= 2 and len(neg) >= 2:
t, p = stats.ttest_ind(pos["YearRet"], neg["YearRet"], equal_var=False, nan_policy="omit")
out["Welch_pvalue"] = float(p)
else:
out["Welch_pvalue"] = np.nan
# Bootstrap CI for diff of means
if len(pos) and len(neg):
rng = np.random.default_rng(seed)
pos_vals = pos["YearRet"].to_numpy()
neg_vals = neg["YearRet"].to_numpy()
diffs = np.empty(bootstrap_iters, dtype=float)
for i in range(bootstrap_iters):
diffs[i] = rng.choice(pos_vals, size=len(pos_vals), replace=True).mean() - \
rng.choice(neg_vals, size=len(neg_vals), replace=True).mean()
out["CI_2.5"] = float(np.percentile(diffs, 2.5))
out["CI_97.5"] = float(np.percentile(diffs, 97.5))
else:
out["CI_2.5"] = np.nan
out["CI_97.5"] = np.nan
return out
def pct(x):
return "n/a" if pd.isna(x) else f"{100*x:,.2f}%"
def run():
print(f"Settings: N_JAN={N_JAN}, START={START}, tickers={TICKERS}")
for ticker in TICKERS:
print("\n" + "=" * 90)
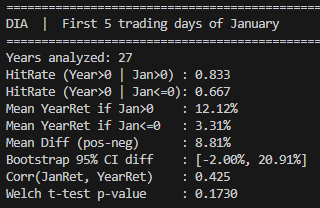
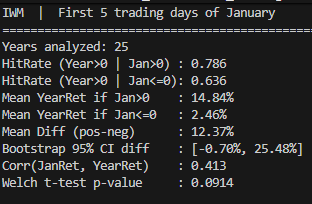
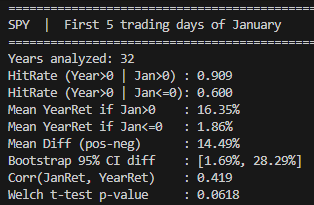
print(f"{ticker} | First {N_JAN} trading days of January")
print("=" * 90)
close = download_close_series(ticker)
year_table = compute_year_table(close, N_JAN)
stats_out = summarize(year_table, BOOTSTRAP_ITERS, SEED)
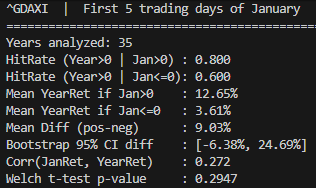
print(f"Years analyzed: {stats_out['Years']}")
print(f"HitRate (Year>0 | Jan>0) : {stats_out['HitRate_Pos']:.3f}")
print(f"HitRate (Year>0 | Jan<=0): {stats_out['HitRate_Neg']:.3f}")
print(f"Mean YearRet if Jan>0 : {pct(stats_out['MeanYear_Pos'])}")
print(f"Mean YearRet if Jan<=0 : {pct(stats_out['MeanYear_Neg'])}")
print(f"Mean Diff (pos-neg) : {pct(stats_out['Diff_PosMinusNeg'])}")
print(f"Bootstrap 95% CI diff : [{pct(stats_out['CI_2.5'])}, {pct(stats_out['CI_97.5'])}]")
print(f"Corr(JanRet, YearRet) : {stats_out['Corr_Jan_Year']:.3f}")
if not pd.isna(stats_out["Welch_pvalue"]):
print(f"Welch t-test p-value : {stats_out['Welch_pvalue']:.4f}")
print("\nLast 8 years:")
tail = year_table.tail(8).copy()
tail["JanRet"] = tail["JanRet"].map(pct)
tail["YearRet"] = tail["YearRet"].map(pct)
print(tail[["JanRet", "YearRet", "JanPos", "YearPos"]].to_string())
# 🔥 HIER die Plots
plot_jan_effect(year_table, ticker, N_JAN)
if __name__ == "__main__":
run()